14 Sep 2026
Climatic Factors Influencing Equine Athletic Data in Seasonal Competitions
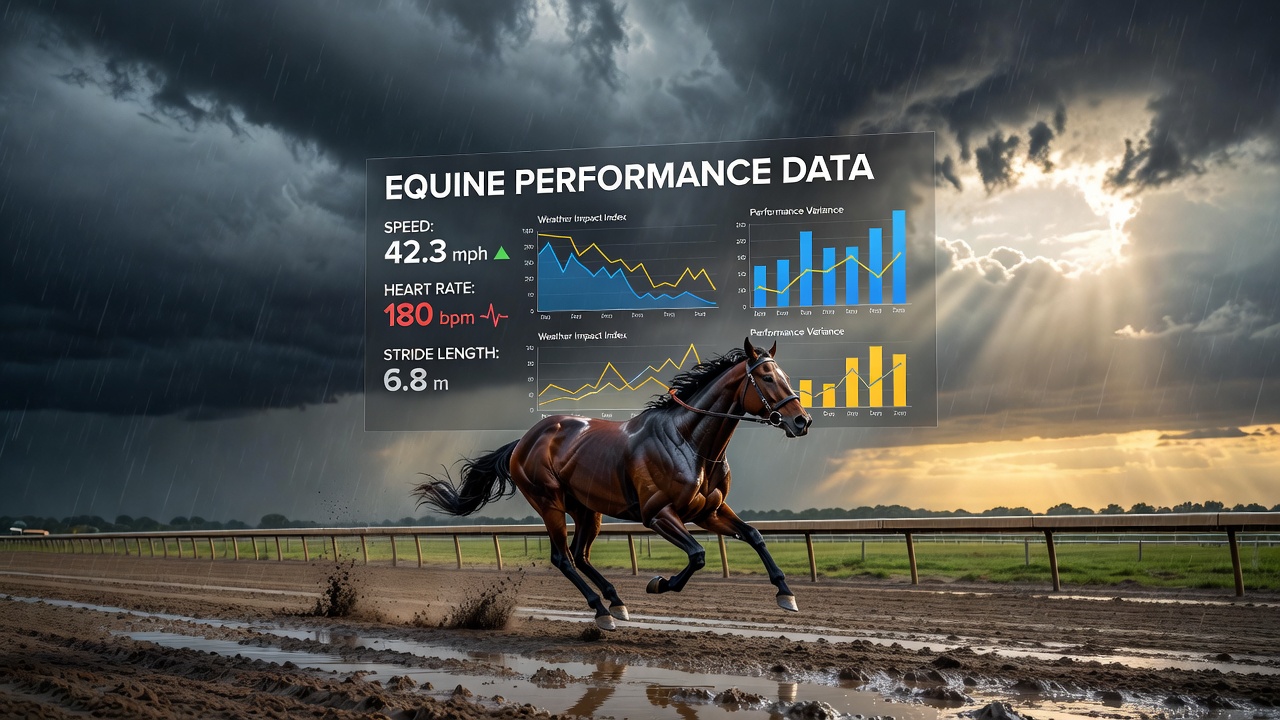
Weather patterns shape the numbers that trainers and analysts collect on horse speeds, recovery times, and endurance levels across different race distances, and researchers have tracked these connections through long-term datasets from multiple continents. Temperature swings alter muscle function and oxygen uptake in horses, while shifts in humidity change how quickly animals lose heat during sustained efforts. Precipitation modifies ground firmness, which in turn adjusts stride length and energy expenditure recorded in performance logs.
Temperature Effects on Recorded Metrics
Data collected over multiple seasons shows that ambient heat above 30 degrees Celsius correlates with slower finishing times in middle-distance events because horses redirect blood flow for cooling rather than peak muscle output. Cold conditions below 5 degrees Celsius produce different patterns, with some studies noting tighter muscle responses that can shorten stride frequency yet increase injury markers in post-race veterinary checks. Observers note that spring transitions often produce the most variable readings, since rapid daily changes force ongoing adjustments in training schedules and data baselines.
Precipitation and Surface Interactions
Rainfall amounts directly influence track ratings that appear in official results, and analysts have documented how even moderate showers soften turf enough to extend race times by several seconds per furlong. Heavy downpours create deeper going that increases energy costs, a factor visible in heart-rate recovery graphs captured by onboard monitors. Those who've compiled multi-year records find that drought periods harden surfaces and generate faster times, yet they also coincide with higher recorded rates of hoof-related issues that affect subsequent starts.
Wind, Humidity, and Combined Variables
Wind speed and direction alter aerodynamic drag on horses during straight sections, and figures from monitoring systems reveal measurable differences when gusts exceed 20 kilometers per hour. High humidity compounds heat stress by limiting evaporative cooling, which shows up in elevated lactate levels measured after workouts. When these elements combine, performance databases display clustered anomalies that require separate statistical treatment from isolated variables.
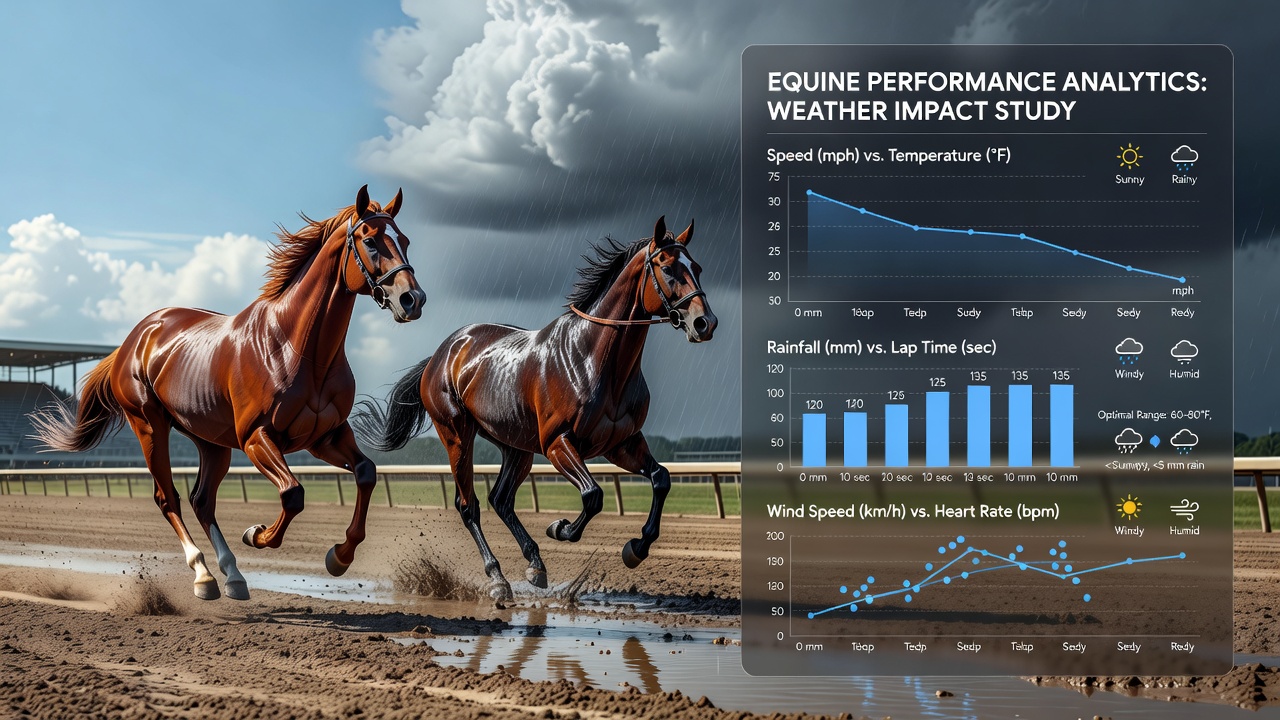
One study from Australian researchers tracked Thoroughbred cohorts through varied weather cycles and found that dew-point thresholds above 18 degrees Celsius produced consistent drops in average sectional speeds during late-race stages. Similar patterns appear in North American datasets maintained by agricultural extension services, where humidity spikes align with reduced voluntary water intake that further depresses output metrics. Those compiling international comparisons note that coastal climates introduce more frequent micro-adjustments than inland zones because of rapid moisture changes.
Seasonal Data Trends and Projections
Longitudinal records indicate that autumn months often yield the clearest separation between weather-driven effects and other variables because temperature gradients stabilize while rainfall patterns remain active. Projections for September 2026 from meteorological services point toward increased variability in precipitation across temperate zones, which could widen the spread of recorded performance values in events scheduled during that period. Analysts using these forecasts adjust baseline models to isolate environmental contributions from training or genetic factors.
Industry organizations such as Australia's Bureau of Meteorology supply the granular climate data that performance researchers cross-reference with equine timing systems. Academic groups at institutions including the University of Guelph maintain parallel datasets that link barometric pressure shifts to changes in stride efficiency captured during standardized exercise tests. These sources allow statisticians to build regression models that quantify how much of any given result stems from atmospheric conditions versus other inputs.
Conclusion
Weather patterns leave measurable traces across equine performance databases, and the connections become visible when analysts integrate meteorological records with timing, physiological, and veterinary statistics. Continued collection of synchronized data supports more precise adjustments in training calendars and event scheduling. As climate records lengthen, the ability to separate environmental signals from other influences improves, giving a clearer picture of how atmospheric conditions shape the numbers that define equine athletic output.