30 Sep 2026
Tracing the Evolution of Performance Indicators in Thoroughbred Racing Over Decades
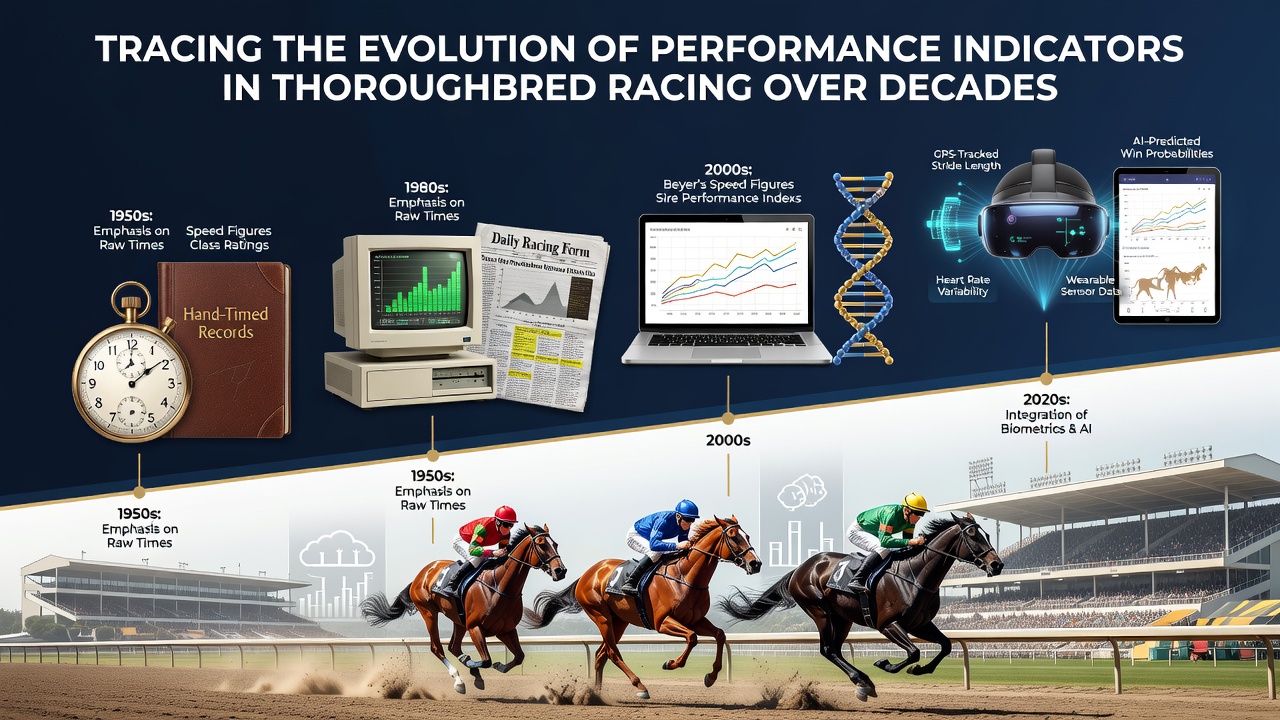
Performance indicators in thoroughbred racing have shifted from simple stopwatch readings and basic finishing positions in the early 1900s to layered datasets that combine speed figures, sectional timings, and biomechanical measurements, and observers note that each decade introduced tools that refined how analysts evaluate equine athletes across different tracks and conditions.
Those who study racing records find that pre-1950s metrics centered on raw times and win rates, while regulatory bodies in the United States such as Equibase later standardized speed ratings that adjusted for track variants and distance. Researchers discovered that these adjustments allowed comparisons between horses racing on fast dirt surfaces in Kentucky and slower turf courses in California, and data from the mid-century period shows trainers began tracking stride length alongside average speed to identify horses that maintained efficiency over longer routes.
Early Foundations and Mid-Century Developments
Records from the 1920s and 1930s reveal that handicappers relied primarily on past position charts and weight carried, yet by the 1960s racing publications started publishing pace figures that broke races into quarters and halves, and analysts used these to separate front-runners from closers. Studies conducted by university veterinary programs in Australia during the 1970s documented correlations between heart rate recovery times and subsequent race outcomes, which led some stables to monitor post-exercise pulse rates as a supplementary indicator of fitness.
What's notable is how international variations emerged, because European authorities emphasized form ratings based on margin of victory and class levels, whereas North American systems prioritized numerical speed indexes, and this divergence persisted until shared databases in the 1990s allowed cross-border analysis of performance trends.
Technological Shifts from the 1980s Onward
Electronic timing systems became widespread in the 1980s, and figures reveal that tracks installed photo-finish cameras that measured margins to hundredths of a second, which replaced earlier manual estimates. Data indicates that breeders and owners then incorporated dosage indices derived from pedigree analysis, and one study from Canadian racing authorities linked these indices to stamina projections in classic-distance races. Trainers adopted video review of gait mechanics around the same period, and observers note that slow-motion playback highlighted inefficiencies invisible during live viewing.
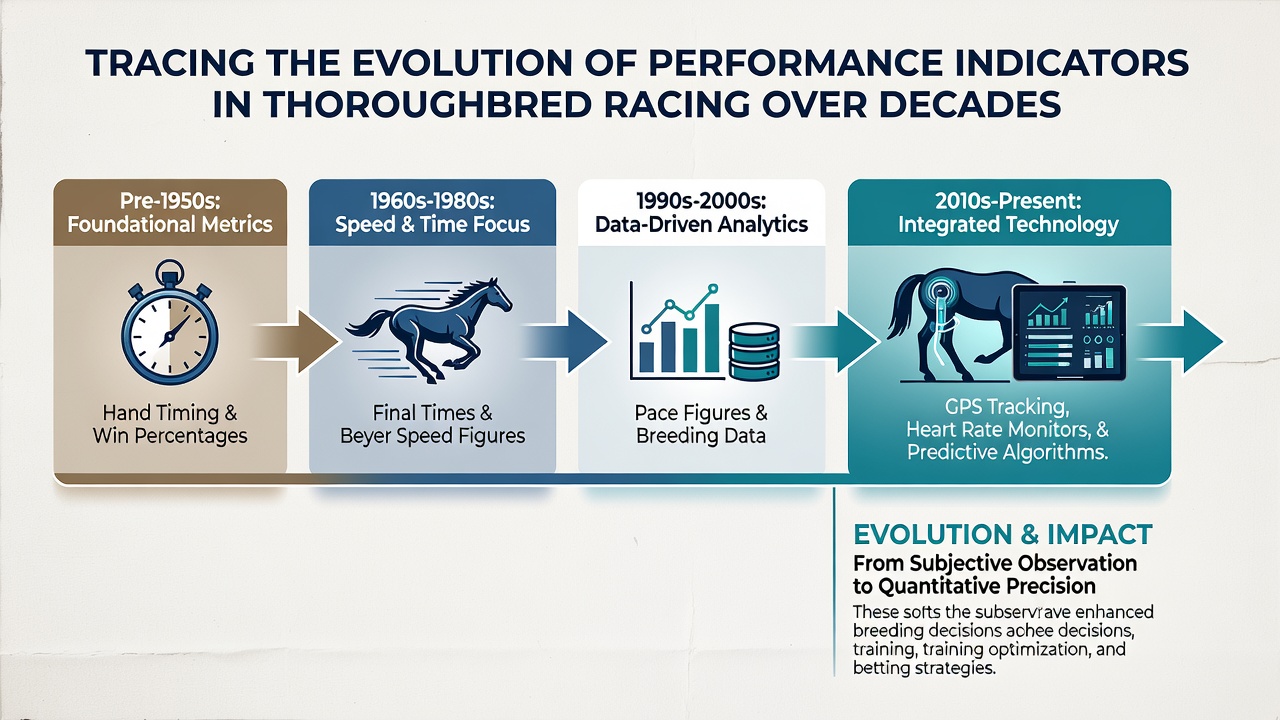
By the early 2000s, GPS and accelerometer devices attached to saddles generated real-time stride data and acceleration curves, while heart-rate monitors transmitted live readings to trainers along the rail. Research published by European equine science groups showed that horses with lower stride frequencies often conserved energy better on undulating courses, and these findings influenced training regimens in France and Ireland. Racing organizations in Japan introduced laser-measured sectional times at multiple points around the track, and the resulting datasets allowed precise identification of horses that accelerated in the final 600 meters.
Contemporary Data Integration and September 2026 Context
Current systems combine satellite positioning, wind sensors, and soil moisture readings into composite performance scores, and evidence suggests these multi-variable models improve prediction accuracy when applied to seasonal competitions. In September 2026 several major tracks plan to release updated benchmark reports that incorporate drone-captured movement patterns alongside traditional speed figures, and industry groups expect these reports to standardize comparisons across synthetic, dirt, and grass surfaces. Regulatory frameworks in Australia and New Zealand already require submission of such integrated data for official handicapping, which creates larger pools of comparable records for analysts.
People who've examined long-term trends note that the introduction of wearable technology reduced reliance on subjective visual scouting, although visual assessment still supplements numerical outputs in many jurisdictions. Figures from academic collaborations between veterinary schools in the United States and South Africa demonstrate that recovery metrics collected 30 minutes after a workout correlate with race-day performance more reliably than single-session speed alone.
Conclusion
Performance indicators in thoroughbred racing continue to expand through successive layers of measurement, and the progression from basic times to integrated sensor networks reflects broader advances in data collection across the sport. Those who track these developments see ongoing refinement as new technologies emerge and regulatory bodies in multiple regions adopt standardized reporting practices that support consistent evaluation of equine athletes worldwide.